President Jacob Zuma. (Photo by Gallo Images / Thapelo Maphakela)
There is bad news all around.
There is not an awful lot of good news about. And every time we battle to pull off some improvement, government tends to score an own goal.
Witness the exchange rate’s reaction and JSE selloff over the past few days following the Mining Charter ‘announcement’ as well as the Public Protector’s pronouncements on the Constitution and the function of the Reserve Bank. Dig into the data, and things are arguably worse than a slightly negative GDP number makes it seem. As commentators have been arguing for a while, this train wreck has been a long time coming….
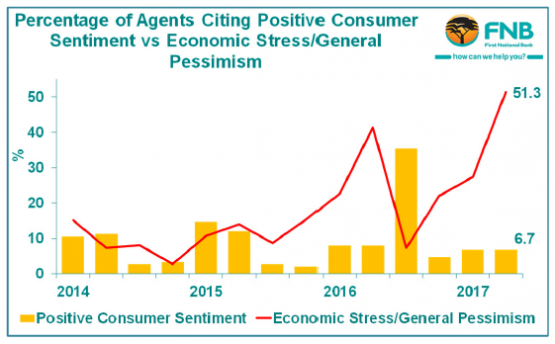
1. More than half of estate agents surveyed are pessimistic
Second quarter residential property research from FNB shows a drop in the residential market activity indicator, after growth in the prior two quarters. The bank says its Estate Agent Survey “provides a further hint that economic recovery is at risk of ‘stalling’ fairly quickly should some fresh news not arise to bolster national sentiment”. Of more concern is a sharp switch to negative sentiment among agents over the past three quarters.
Source: FNB
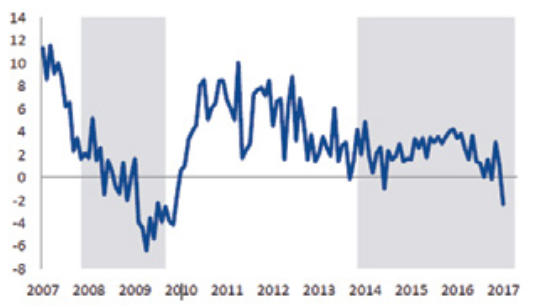
2. The retail sales boom has run out of steam
The longer-term trend in real retail sales growth is worrying. We obviously do not want an economy wholly reliant on consumption, but a decent recovery between 2014 and 2016 has turned negative, with likely more surprises on the downside to come.
Source: StatsSA
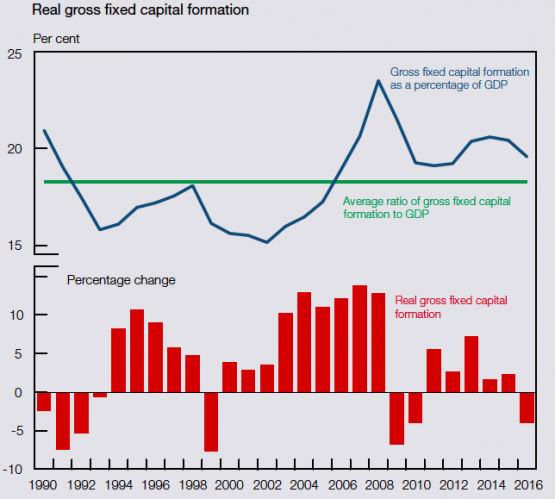
3. Gross fixed capital formation barely positive
This is not ‘new’ news, but growth in aggregate real gross fixed capital formation averaged 9.2% a year in the nine years up to the financial crisis in 2008/09. In the eight years since, growth has been a “mere 0.6% per year”. Simply put, we (both government and the private sector) are not investing in more machinery, plant/equipment, vehicles, buildings, roads, railways, power stations, etc. This is the infrastructure that drives growth – or doesn’t.
Source: StatsSA and Sarb
4. Employment slumps in the ‘heart’ of the economy
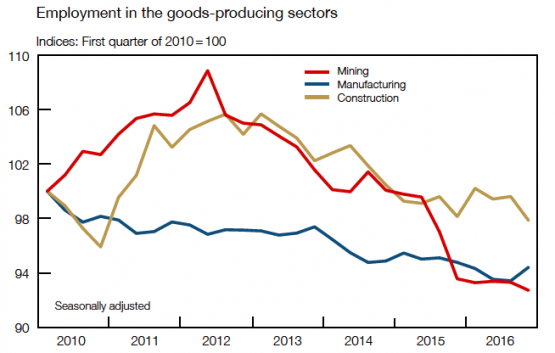
Employment in the three major goods-producing sectors of the economy – mining, manufacturing and construction – is in decline, some would argue structurally so. There is no quick fix to reverse the situation in any of these sectors. While Q4 saw a “surprising” increase in employment in the manufacturing sector, confidence continues to decline and is now at 28 index points (out of 100!). The Bureau for Economic Research notes that the index has been “below 50 points since the first half of 2011”. A majority of survey respondents reported “a decline in fixed investment levels, with the political climate and the tax structure seriously constraining… investment.”
Source: StatsSA and Sarb
5. Those with jobs are getting poorer
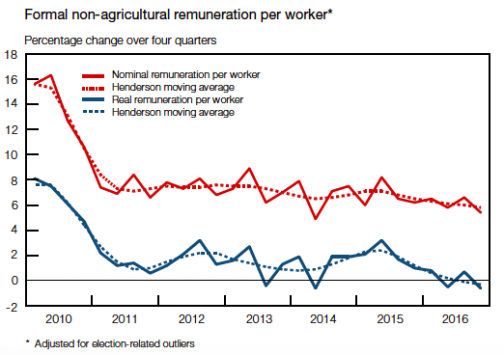
Real wage increases (i.e. after inflation) have been bumbling along at around the 2% mark from 2011 to 2015, but slipped to effectively zero (0.2%) in 2016. Obviously, the spike in consumer price inflation last year contributed to this. However, while government employees saw an acceleration in wage growth (from 7.2% in 2015 to 8.6% in 2016), those in the private sector saw wage growth of just 5.1% (on average) last year, significantly below inflation (from 6.5% in 2015).
Source: StatsSA and Sarb
6. We’re going to be building a lot less
The value of building plans passed at larger municipalities declined by 17% in the first four months of 2017, when compared to the same period last year. Residential buildings decreased by 11% (or R2.1 billion) to R15.6 billion, while non-residential buildings fell by 39% to R6.6 billion. The trend has turned sharply negative this year, after a moderate decline in 2016. Given the lag, the trend in buildings completed remains positive, although based on the chart below, it will turn negative soon.
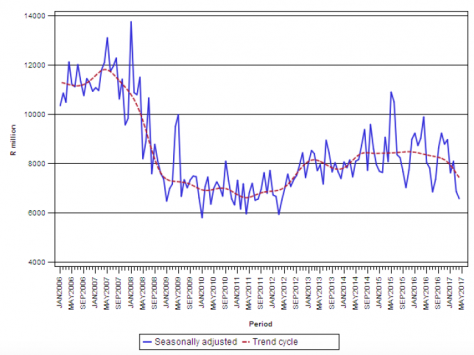
Real value of recorded building plans passed by larger municipalities, at constant 2015 prices
Source: StatsSA
7. Foreigners are bailing out of the JSE at pace
The Sarb’s Quarterly Bulletin notes dourly that “non-resident investors’ negative sentiment towards JSE listed shares persisted in 2017”. Foreigners were net sellers of shares “to the value of R55 billion in the first five months of 2017, following significant net sales of R124 billion in 2016”. What’s terrifying is that as of last Thursday (June 15), net sales had soared to R77.4 billion in the year to date. The portion of JSE listed shares held by foreigners was (on average) 21% in the first five months of this year (from 23% in the same period in 2016).
8. New car sales have not yet bottomed out
According to the latest (May) data disclosed by Naamsa, 23 358 fewer new passenger vehicles have been sold in the first five months of this year when compared to the same period last year (128 011 vs 151 369). Wesbank says the forecast for marginal growth this year has been affected by political and economic uncertainty. In other words, we will probably see another year of decline. The replacement cycle has “extended by 9% compared to May last year”.
* Hilton Tarrant works at immedia. He can still be contacted at hilton@moneyweb.co.za.

