Daniel Seligman
There is no getting around
certain large and troubling implications of black-white differences. The
implications seem most troubling when you turn from the average differences
and focus instead on the differences at the extreme — when you contrast
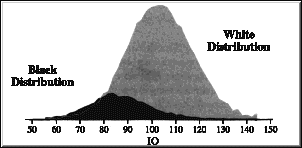
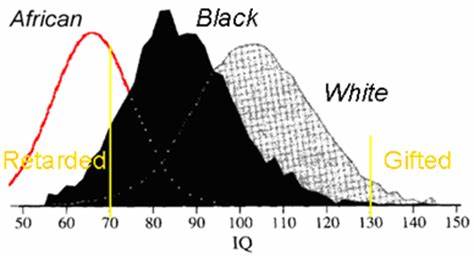
the two overlapping bell-shaped distribution curves and look at the proportions
in each group scoring above and below certain levels. If you tell yourself
that the top professional and managerial jobs in this country require an
IQ of at least 115 or thereabouts, then you also have to tell yourself
that only about 2.5 percent of blacks appear able to compete for those
jobs. The comparable figure for whites would be about 16 percent. Total
black population with IQs over 115: 800,000. Comparable figure for whites:
about 30 million. If blacks had the same IQ distribution as whites, the
black total would be over 5 million.

The data are even more depressing on the downside. An IQ in the 70-75 range, which many psychologists would label “borderline retarded,” implies a life that is guaranteed to be short of opportunities. Very few students in that range will absorb much of what elementary schools teach, and virtually none will graduate from high school; few will succeed in finding and keeping good jobs. None will be admitted into the armed forces (required by law to screen out the lowest ten percent of the distribution). The bad news is that a substantial minority — apparently more than one in five — of American blacks have IQs below 75. Around one in twenty whites are below 75.
[…]
The black-white gap is 15 points when measured on the Wechsler tests, 18 on the Stanford-Binet. Both tests are, of course, normed so as to produce an average of 100, but the white average is a bit higher. On the Wechsler metric, whites and blacks average 102 and 87, respectively. On both tests, the gap between the races is almost exactly 1 SD (standard deviation). The gap of 1 SD has been observed since the earliest days of intelligence testing.
There are also significant black-white differences in the structure of mental abilities. The test-score patterns show that the two groups are good at different things. On average, whites do better on all the subtests, but their margin of superiority varies considerably from one subtest to another. Or look at it this way: If you took a sample of black and white children, all of whom had scored around 100 on the WISC-R — that is, the black kids in the sample were above the black average — you would expect to find significant black-white differences on six of the thirteen subtests. The average black kid would do better on Arithmetic and Digit Span; the average white kid would do better on Comprehension, Block Design, Object Assembly, and Mazes …
These subtest differences have one common theme, and its name is g. The tests on which the gap is greatest are those with the most g-loading — which means, in general, those that call most heavily on reasoning and problem-solving abilities. The June 1985 issue of The Behavioral and Brain Sciences carries a long report by Arthur Jensen analyzing eleven sizable studies of black-white IQ differences. The underlying data had been collected by different researchers at different times (but none before 1970). All the studies had several things in common: All were based on large population samples, all measured a broad range of mental abilities, and all included black-white breakdowns of their various subtests.
In all eleven studies, Jensen found consistently strong positive correlations between the size of the black-white gap on subtests and the extent to which the subtests called on g … The correlation coefficient, after appropriate adjustments, appears to be well above .60.
In other words, the black-white IQ gap is in large measure a reflection of differences in reasoning and problem-solving ability.
This was not exactly news in 1985. Long before Jensen set out to quantify the “g effect” in black-white differences, it was generally well known that the differences were greatest in measures of abstract reasoning, not so great in measures of verbal skill, smallest of all in memory and rote learning.
Excerpted from A Question of Intelligence: The IQ Debate in America (New York: Birch Lane, 1992), 150-153.

Paroxysms of Denial
Arthur Jensen
[…]
Nowadays the factual basis of The Bell Curve is scarcely debated by the experts, who regard it as mainstream knowledge.
The most well-established facts: Individual differences in general cognitive ability are reliably measured by IQ tests. IQ is strongly related, probably more than any other single measurable trait, to many important educational, occupational, economic and social variables. (Not mentioned in the book is that IQ is also correlated with a number of variables of the brain, including its size, electrical potentials, and rate of glucose metabolism during cognitive activity.) Individual differences in adult IQ are largely genetic, with heritability of about 70 percent. So far, attempts to raise IQ by educational or psychological means have failed to show appreciable lasting effects on cognitive ability and scholastic achievement. The IQ distribution in two population groups socially recognized as “black” and “white” is represented by two largely overlapping bell curves with their means separated by about 15 points, a difference not due to test bias. IQ has the same meaning and practical predictive validity for both groups. Tests do not create differences; they merely reflect them.
[…]
Although social problems involving race are conspicuously in the news these days, too few journalists are willing or able to discuss rationally certain possible causes. The authors’ crime, apparently, is that they do exactly this, arguing with impressive evidence that the implications of IQ variance in American society can’t be excluded from a realistic diagnosis of its social problems.
The media’s spectacular denial probably arises from the juxtaposition of the book’s demonstrations; first, that what is termed “social pathology” — delinquency, crime, drug abuse, illegitimacy, child neglect, permanent welfare dependency — is disproportionately concentrated (for whites and blacks alike) in the segment of the population with IQs below 75; and second, that at least one-fourth of the black population (compared to one-twentieth of the white population) falls below that critical IQ point in the bell curve. Because the smaller percentage of white persons with IQs below 75 are fairly well scattered throughout the population, many are guided, helped, and protected by their abler families, friends, and neighbors, whose IQs average closer to 100. Relatively few are liable to be concentrated in the poor neighborhoods and housing projects that harbor the “critical mass” of very low IQs which generates more than its fair share of social pathology. The “critical mass” effect exists mostly in the inner city, which has been largely abandoned by whites. Of course thinking citizens are troubled. Thinking about possible constructive remedies strains one’s wisdom.
But can any good for anyone result from sweeping the problem under the rug? Shouldn’t it be exposed to earnest, fair-minded public discussion? Our only fear, I think, should be that such discussion might not happen. Consideration of the book’s actual content is being displaced by the rhetoric of denial: name calling (“neo-nazi,” “pseudo-scientific,” “racism”), sidetracks (“but does IQ really measure intelligence?”), non-sequiturs (“specific genes for IQ have not been identified, so we can claim nothing about its heritability”), red herrings (“Hitler misused genetics”), falsehoods (“all the tests are biased”), hyperbole (“throwing gasoline on a fire”), and insults (“creepy,” “indecent,” “ugly”).
The remedy for this obfuscation is simply to read the book itself.
Excerpted from National Review, December 5, 1994, 48-50.

