It happened on a Wednesday morning. The Sandwich Man, dressed in a red T-shirt with white lettering, rode past me on his bicycle on the same stretch of the same road at the same time as the day before. I watched him roll by in a sobering moment that recalled all the horror of the five-day commute. The cyclical days, the shuffling masses, the dull ebbing of a scripted month.
Getting onto the westbound Central Line at rush-hour Liverpool Street is one of the most stressful things I do all week. Doing so five times would surely affect my frame of mind.
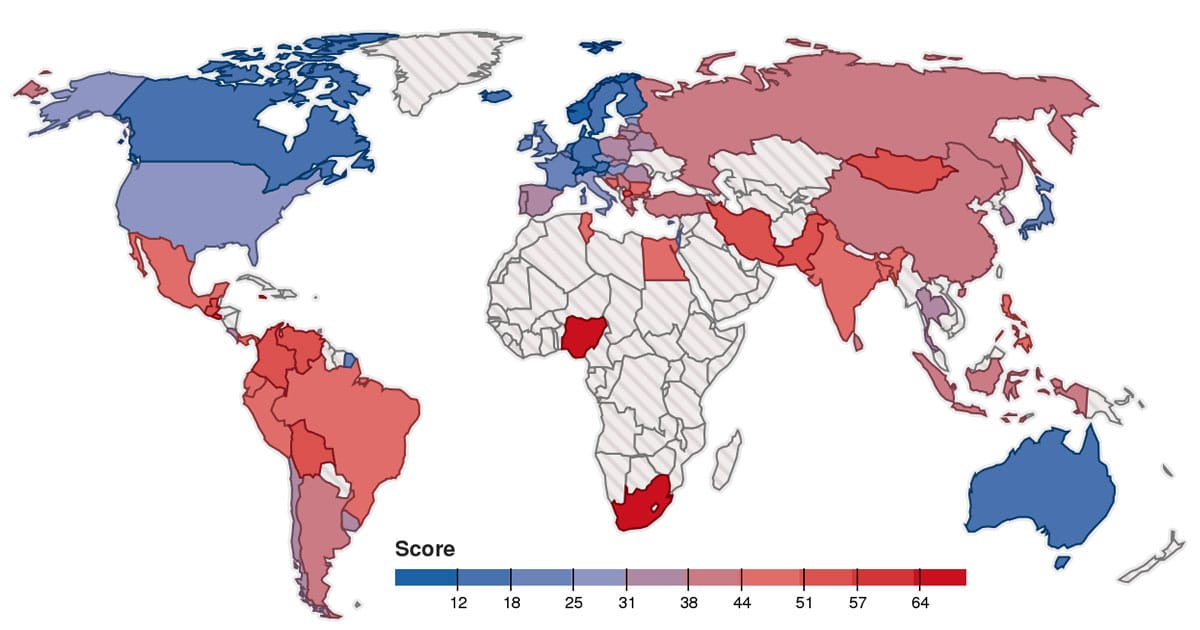
Of course, it’s important to remember that my homeland of the UK is one of the safest countries in the world. Moreover, according to Bloomberg’s data on the world’s most stressed countries, the UK is one of the calmer ones. Here’s how we fare compared against others.
MOST STRESSED COUNTRIES – METHODOLOGY
The first thing to note is that the ranking includes 74 countries only. Comprehensive data could not be found for every country in the world and the ranking is therefore restricted to only those countries that can be fairly compared.
Bloomberg’s study uses seven equally weighted variables: homicide rates, GDP per capita (adjusted for purchasing-power parity), income inequality, corruption perception, unemployment, urban air pollution and life expectancy.
Countries were allotted points for each variable based on their relative position in that category’s ranking. The country with the least-stressful measure for each variable received 0 points, while the country with the highest stress level received 100 points. All other countries were scored on a percentile basis depending on their position between the two extremes. Points for the seven variables were averaged for a final score from 0 to 100, a higher score indicating a more stressful living environment.

Only countries with data available for all seven variables were included.
MOST STRESSED COUNTRIES – RANKED
UR = Unemployment Rate (%)
LE = Life Expectancy (years at birth)
| RANK | COUNTRY | SCORE | UR (%) | LE (YRS) |
|---|---|---|---|---|
| 1 | Nigeria | 70.1 | 23.9 | 53 |
| 2 | South Africa | 70.0 | 25.7 | 58 |
| 3 | El Salvador | 57.6 | 5.7 | 72 |
| 4 | Mongolia | 55.4 | 6.1 | 68 |
| 5 | Guatemala | 55.1 | 4.1 | 69 |
| 6 | Colombia | 53.6 | 10.3 | 78 |
| 7 | Pakistan | 52.7 | 9.2 | 67 |
| 8 | Jamaica | 52.3 | 13.0 | 75 |
| 9 | Macedonia | 52.0 | 30.0 | 75 |
| 10 | Bolivia | 51.5 | 5.4 | 67 |
| 11 | Iran | 51.4 | 13.4 | 73 |
| 12 | Venezuela | 51.1 | 7.8 | 75 |
| 13 | Bosnia and He… | 50.2 | 27.0 | 76 |
| 14 | India | 48.9 | 9.9 | 65 |
| 15 | Egypt | 46.4 | 13.6 | 73 |
| 16 | Mexico | 46.3 | 4.8 | 75 |
| 17 | Brazil | 45.3 | 6.0 | 74 |
| 18 | Philippines | 45.2 | 7.0 | 69 |
| 19 | Bangladesh | 45.0 | 5.0 | 70 |
| 19 | Ecuador | 45.0 | 5.8 | 76 |
| 21 | Tunisia | 44.8 | 16.7 | 76 |
| 22 | Panama | 44.3 | 4.2 | 77 |
| 23 | Bulgaria | 44.2 | 12.4 | 74 |
| 23 | Peru | 44.2 | 6.8 | 77 |
| 25 | Indonesia | 43.8 | 6.1 | 69 |
| 25 | Russia | 43.8 | 5.5 | 69 |
| 27 | Sri Lanka | 43.4 | 4.9 | 75 |
| 28 | Serbia | 42.7 | 23.0 | 74 |
| 29 | China | 42.3 | 4.1 | 76 |
| 30 | Greece | 41.8 | 27.0 | 81 |
| 31 | Argentina | 40.1 | 7.1 | 76 |
| 32 | Turkey | 38.5 | 9.4 | 76 |
| 33 | Costa Rica | 37.8 | 6.5 | 79 |
| 34 | Latvia | 37.5 | 13.3 | 74 |
| 35 | Thailand | 37.1 | 0.7 | 74 |
| 36 | Croatia | 36.1 | 15.2 | 77 |
| 37 | South Korea | 35.9 | 3.3 | 69 |
| 38 | Lithuania | 35.8 | 12.0 | 74 |
| 39 | Romania | 35.6 | 7.0 | 74 |
| 40 | Chile | 34.4 | 6.5 | 79 |
| 41 | Belarus | 34.1 | 0.6 | 71 |
| 42 | Mauritius | 33.9 | 8.0 | 74 |
| 43 | Portugal | 33.8 | 18.3 | 80 |
| 44 | Spain | 33.1 | 27.0 | 82 |
| 44 | Slovakia | 33.1 | 14.3 | 76 |
| 46 | Poland | 32.8 | 11.0 | 76 |
| 47 | Uruguay | 32.4 | 6.5 | 77 |
| 48 | Italy | 30.4 | 12.0 | 82 |
| 49 | Czech Republic | 30.3 | 8.1 | 78 |
| 50 | Hungary | 30.0 | 10.5 | 75 |
| 51 | Israel | 28.6 | 7.0 | 82 |
| 52 | Estonia | 28.1 | 7.8 | 76 |
| 53 | Cyprus | 27.3 | 12.1 | 81 |
| 54 | United States | 25.7 | 7.7 | 79 |
| 55 | Malta | 25.4 | 6.4 | 80 |
| 56 | Slovenia | 24.6 | 9.8 | 80 |
| 56 | United Kingdom | 24.6 | 7.8 | 80 |
| 58 | Ireland | 24.3 | 14.2 | 81 |
| 59 | France | 22.8 | 11.2 | 82 |
| 60 | Japan | 19.9 | 4.1 | 83 |
| 61 | Belgium | 19.4 | 8.0 | 80 |
| 62 | Singapore | 19.2 | 2.0 | 82 |
| 63 | Austria | 17.1 | 4.6 | 81 |
| 64 | Netherlands | 16.9 | 6.3 | 81 |
| 65 | Canada | 16.6 | 7.3 | 82 |
| 65 | Germany | 16.6 | 5.7 | 81 |
| 67 | Iceland | 15.4 | 5.0 | 82 |
| 68 | Finland | 14.9 | 8.1 | 81 |
| 69 | Denmark | 13.8 | 7.6 | 79 |
| 70 | Australia | 12.2 | 5.3 | 82 |
| 71 | Sweden | 12.1 | 8.1 | 82 |
| 72 | Switzerland | 9.2.0 | 3.2 | 83 |
| 73 | Luxembourg | 7.1.0 | 6.3 | 82 |
| 74 | Norway | 5.4.0 | 3.1 | 81 |
Source: Bloomberg, 2013 (via United Nations Office on Drugs and Crime, International Monetary Fund, Central Intelligence Agency World Factbook, Transparency International, World Health Organization)
(Lead image: Dreamstime)
http://www.atlasandboots.com/most-stressed-countries/

