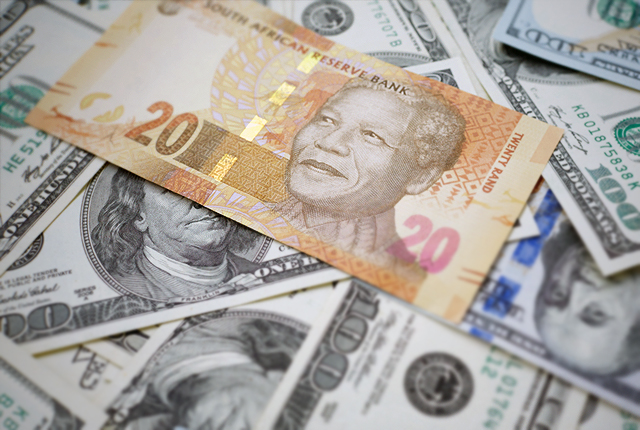
The rand took a big knock in December 2015 – 9/12 – after President Jacob Zuma unexpectedly fired finance minister Nhlanhla Nene, and replaced him with an ANC back-bencher David van Rooyen.
Despite the president’s claims to the contrary, economists and analysts said the move had a profound impact on investor confidence in the country, leading to a mass exodus of capital.
Combined with extremely slow growth, a widening current account deficit and one of the worst droughts in the country’s history, the rand has remained stubbornly weak, unable to break back through R15 to the dollar.
International factors
Global growth has slowed, led by China which has been unable to prevent a slow down in its markets. This in turn has led to a decline in demand for commodities (which hits South Africa hard, as China is one of our main importers).
Sanctions have been lifted against Iran, which has resulted in an oversupply of oil in the global market, dragging the oil price down to below $30 a barrel.
While the oil price has recovered in recent sessions – $40 a barrel – this reflects a short-term boon for the energy market, with many analysts expecting $30 a barrel to be the benchmark for the foreseeable future.
These global factors, along with decisions made in big markets such as the USA, the UK and China, all have an additional impact on the rand.
On Thursday (10 March), the rand flirted with R15.00 to the dollar – its strongest point in recent weeks – due to a decision by the European Central Bank to cut interest rates and expand its quantitative easing programme.
However, it’s the local factors which will decide the rand’s future – with a looming credit rating cut to junk, and business-unfriendly economic policies threatening to push the currency even higher against the dollar.
Rand history
Before 9/12, South Africa’s weakest point against the dollar was R12.45 in December 2001.
In December 2015, the rand crashed to R15.38, before getting within a fraction of R18 to the dollar in early January – though very briefly.
The rand’s new (stable) record low is at R16.86, while it is currently trading at around R15.25 to the dollar.
The graphic below shows the year-on-year changes in the rand for 11 March from 1978 to 2016.
Two peaks prior to 9/12 stand out, reflecting the economic fallout of the terrorist attacks on the United States on 9/11 2001, and the global economic crisis which hit in 2008 and 2009, which led to a global recession.
| Year | Rand vs Dollar (11 March) |
|---|---|
| 1978 | 0.87 |
| 1979 | 0.84 |
| 1980 | 0.81 |
| 1981 | 0.79 |
| 1982 | 0.98 |
| 1983 | 1.12 |
| 1984 | 1.20 |
| 1985 | 2.00 |
| 1986 | 1.99 |
| 1987 | 2.09 |
| 1988 | 2.11 |
| 1989 | 2.53 |
| 1990 | 2.59 |
| 1991 | 2.63 |
| 1992 | 2.89 |
| 1993 | 3.19 |
| 1994 | 3.42 |
| 1995 | 3.63 |
| 1996 | 3.95 |
| 1997 | 4.42 |
| 1998 | 4.98 |
| 1999 | 6.15 |
| 2000 | 6.39 |
| 2001 | 7.77 |
| 2002 | 11.47 |
| 2003 | 7.91 |
| 2004 | 6.71 |
| 2005 | 5.85 |
| 2006 | 6.28 |
| 2007 | 7.39 |
| 2008 | 7.99 |
| 2009 | 10.32 |
| 2010 | 7.46 |
| 2011 | 6.91 |
| 2012 | 7.59 |
| 2013 | 9.11 |
| 2014 | 10.79 |
| 2015 | 12.26 |
| 2016 | 15.23 |
More on the rand
Rand flirts with R15 vs the dollar
Weak rand curbs SA employers from hiring


