The greatest economic fallacy of the modern era is a belief that man knows better than the market. The contrast between the market driven growth rates enjoyed by the US and China with the collapse of a centralised command and control effort by the Soviet Union tells a powerful story. But it has never been easy for politicians to step aside and let the market’s invisible hand do the work. Getting into power often fools them into believing that because voters want populist economic policies, these actually work. Time and again – Cuba, Venezuela, Argentina, Zimbabwe, etc – the outcome of market suppression has been disastrous. Economic growth happens when you get the incentives right. Excessive interference, no matter how well intentioned, always leads to misery through expanding poverty. India is the latest example proving this reality. After 60 years of well-intentioned socialist intervention, the nation voted in a political party which recognises the power of the market. The unleashing of India’s massive human potential has put the economy onto a different growth trajectory – one where 7.5% a year is regarded as the bare minimum. China had the same experience after its communist leaders realised that political power could be centralised but economic growth not. The data shows rather forcefully that the ANC’s strategy of tampering with State Owned Enterprises (cadre deployment) and social engineering (BEE legislation) is having the wrong end result in South Africa. Especially since Jacob Zuma moved into the big office. John Maynard is the pen name of an independent economist who is obsessed by statistics. He lets the numbers do the talking in this excellent contribution. See more of his work at South African Market Insights. – Alec Hogg
By John Maynard*
South Africa is one of the most mineral rich countries in the world, with massive gold, diamond, coal, iron ore and platinum deposits spread across the country. It has vast agricultural land and the ideal climate for the production of wheat and maize. Its climate also provides perfect conditions for wine making.

During the Apartheid years, loads of sanctions were in place against South Africa. This necessitated South Africa to locally develop or manufacture goods that could not be imported. Leading to a strong manufacturing industry within South Africa to supply the local market. The economy was, however, closed and little trade took place between South Africa and the rest of the world during the Apartheid years. Strict rules regarding the flow of money out of the country was in place too, leading to little money leaving the country. This in turn led to the development of a strong banking system in South Africa.
Most of the technical and skilled labour was made up by white people as the Apartheid regime favoured the minority. The same goes for access to education, water, electricity, health, transport routes etc, leading to a skew distribution of income and quality of life in South Africa.
So with the background provided we will now look at South Africa’s economic history since the dawn of democracy. This includes GDP growth rates, inflation and exchange rate performances per president of the Republic.
The graph below provides a snapshot of the economic performance of South Africa under its various presidents (including the last few quarters under president FW De Klerk who was the last president of South Africa before a new president was democratically elected. We would like to show growth during the transition from Apartheid). Each president’s economic performance will be discussed in more detail.

While looking at the economic performance of South Africa by President is useful, one should also take into account who was the Minister of Finance at the time – the man who implements economic policy. Here’s the graph below.

Most finance ministers had a pretty successful track record as South Africa’s economy had few periods of negative economic growth over the last 22 years. But South Africa has experienced a lot of slow to no growth. Thus not necessarily negative economic growth, but growth that seems to be stagnating around zero.
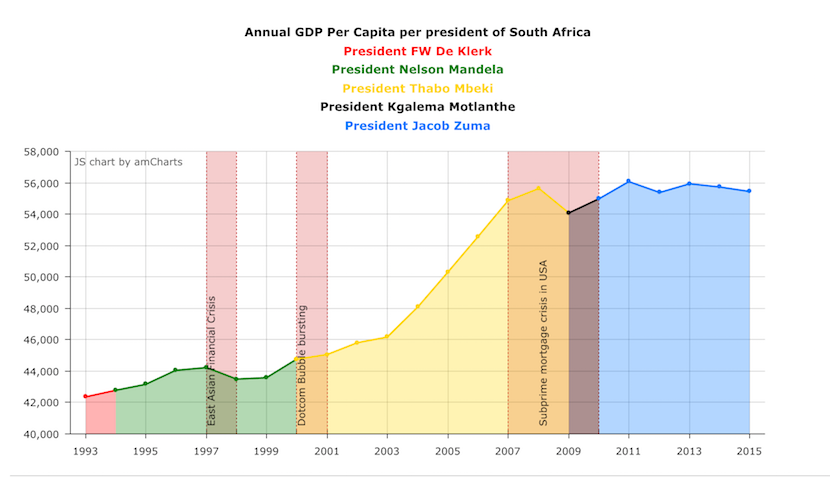
The problem with such growth is that if the economy grows at a slower rate than the population, the average citizen in South Africa gets poorer over time. A useful measure of this is what is known as GDP per capita. GDP per capita measures the value of the economy expressed per person living in it.
Below a graph showing South Africa’s annual GDP per capita (Rand value of the South African Economy per person living in it, as calculated by South African Market Insights). As can be seen from the graph during Thabo Mbeki’s tenure South Africans enjoyed a surge in GDP per capita, while more recently the GDP per capita has remained relatively flat (hardly any growth from 2010 to 2015).
This is partly due to low/no economic growth, while the population steadily kept increasing (thus more people sharing the spoils of the South African economy). If the population growth keeps outstripping the economic growth the country will grow poorer per person.

While the graphs above gives a good indication of South Africa’s economic performance since the rise of democracy, another indicator of a country’s economic performance is a country’s exchange rate. In particular its exchange rate against the most traded currency in the world (the US Dollar).
A strong/appreciating local currency shows a willingness of foreign investors to invest in a country, while a weaker/depreciating currency shows a lack of willingness of foreign investors to invest in a country. I.e the higher the demand for a country’s currency the stronger it will be, and visa versa.
The graph below shows the average exchange rate per year under each of South Africa’s presidents. While the exchange rate is influenced by a lot of factors, it is a very good indicator of economic sentiment towards a country. As can be seen from the exchange rate graph below, sentiment towards South Africa has been deteriorating at an increasing rate over the last couple of years, further adding to South Africa’s list of economic problems, as less foreign investments into South Africa, leads to less growth and development, and the continuing cycle of stagnating economic growth.

The graph below combines the annual GDP per capita (in Rand terms) and the average Rand/Dollar exchange rate per year and calculates South Africa’s GDP per capita (expressed in US Dollars). As can be seen from the graph it has been an abysmal performance for the last 20 odd years.


